A library to create charts in wxWidgets applications.
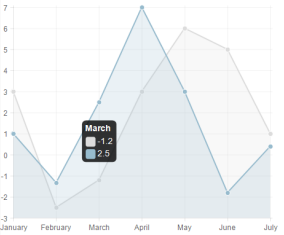
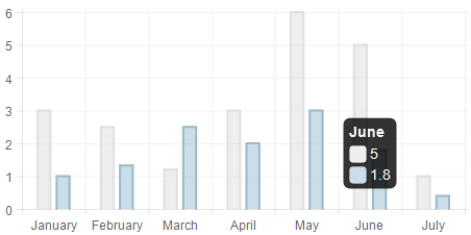
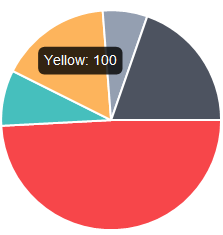
Here is a small sample of the charts that can be created with the wxCharts library. For a more complete list see the wxCharts website.
| Line Chart | Column Chart | Pie Chart |
|---|---|---|
 |
 |
 |
This project is in its development phase.
Many of the charts are ready to be used but others still need to be implemented. For the charts that have been implemented it is likely that you will need features that have not been implemented yet. Please let us know if this is the case and we will work on them. You can also of course fork the project and make any customization you require.
Also documentation is currently lacking and mostly limited to the samples available in this repository. Don't hesitate to ask us for help.
See Installation.
For all questions about this project you can raise an issue on GitHub.
See the contribution guidelines.
We use CircleCI to run a continuous build of the master branch of the wxCharts project.
wxCharts is largely based on the Chart.js project (http://chartjs.org/). It re-used many of the ideas and implementations of that project and adapted them to C++ and the wxWidgets environment.
Copyright (c) 2015-2024 Xavier Leclercq and the wxCharts contributors
This work is licensed under the MIT License
See https://github.com/wxIshiko/wxCharts/blob/main/LICENSE.txt